Google Analytics Dashboard – Standard
Google Analytics Dashboard – Standard
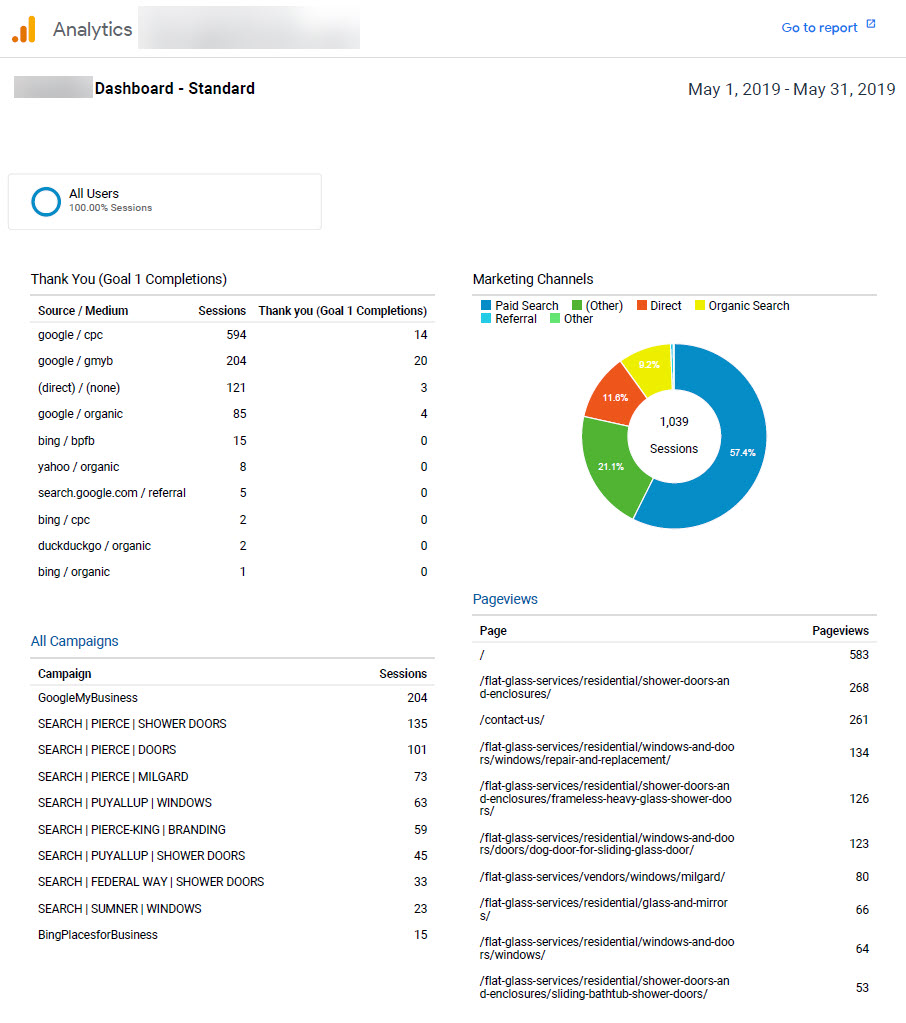
This document is an explanation of the Client’s Standard Dashboard. The dashboard is divided into 4 sections.
Section 1 (Top Left) – Goal Completions (normally Goal 1)
The first column lists the Source/Medium which describes where your traffic comes from. The Source is the place users are before seeing your content, like a search engine or another website. The Medium describes how users arrived at your content. Values for Medium include “organic” for unpaid search traffic and “none” for direct traffic.
The second (middle) column lists the total number of Sessions within the date range. A session is the period of time a user is actively engaged with your website, app, etc.
The third column list the number of Goal completions within the data range.
Section 2 (Top Right) – Marketing Channels
This section is a donut/pie chart that shows the various channels where your traffic come from. The channels are color coded.
Section 3 (Bottom Left) – All Campaigns
The first column lists the names of your campaigns. This list includes paid and non-paid campaigns.
The second column lists the total number of Sessions within the date range. A session is the period of time a user is actively engaged with your website, app, etc.
Section 4 (Bottom Right) – Pageviews
The first column is the name of the pages visited, listed by URI (Universal Resource Indicator). The URI is the portion of a page’s URL following the domain name; for example, the URI portion of www.example.com/contact.html is /contact.html.
The second column is the total number of pages viewed. Repeated views of a single page are counted.
_P3.1.2 – Google Dashboard Creation – STD.docx

