Google Analytics Dashboard – Advertising
Google Analytics Dashboard – Advertising
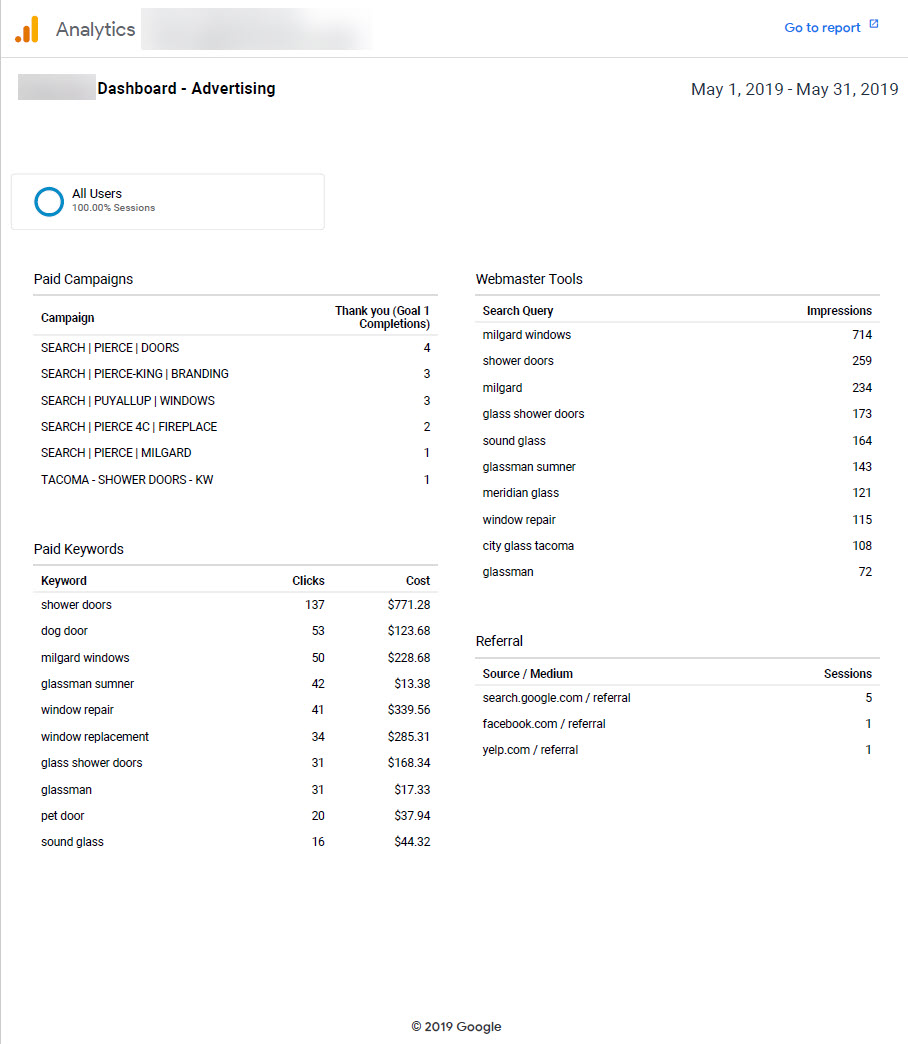
This document is an explanation of the Client’s Advertising Dashboard. The dashboard is divided into 4 sections.
Section 1 (Top Left) – Paid Campaigns
The first column lists the names of your Paid ads campaign. This list includes paid campaigns only.
The second column shows the count of Goal completions for the particular campaign.
Section 2 (Top Right) – Google Ads
The first column lists the actual search query that triggered impressions.
The second column shows the count of how often your paid ad is shown. An impression is counted each time your paid ad is shown on a search result page.
Section 3 (Bottom Left) – Paid Keywords
The first column lists the Paid keywords used by potential customers to reach your site.
The second column shows the number of times potential customers click on your ad.
The third column lists the total amount you paid for that keyword.
Section 4 (Bottom Right) – Referral
The first column is the Source/Medium which describes where your traffic comes from. The Source is the place users are before seeing your content, like a search engine or another website. The Medium describes how users arrived at your content. The Medium is filtered to only include ‘referral’ traffic. Referrals show you sites that “referred” visitors to your site by clicking a link.
The second column is the total number of Sessions within the date range. A session is the period of time a user is actively engaged with your website, app, etc.

